Bioenergy and Bioproducts
Quantifying soil greenhouse gas fluxes in bioenergy crops after bioproduct fertilizer amendments.
The application of different types of fertilizers to the bioenergy crop Miscanthus x giganteus could lead to a net increase in soil greenhouse gas (GHG) emissions if the right fertilizer and amount is not applied. This study evaluated the impacts of four different fertilization treatments (digestate from a biodigester, synthetic fertilizer (urea), hydrochar from the hydrothermal carbonization of digestate, and a control) on soil GHG emissions and biomass yield of an established Miscanthus stand grown on abandoned agricultural land.
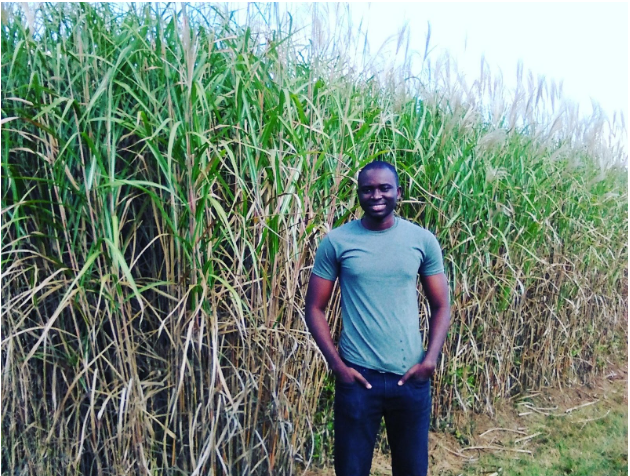
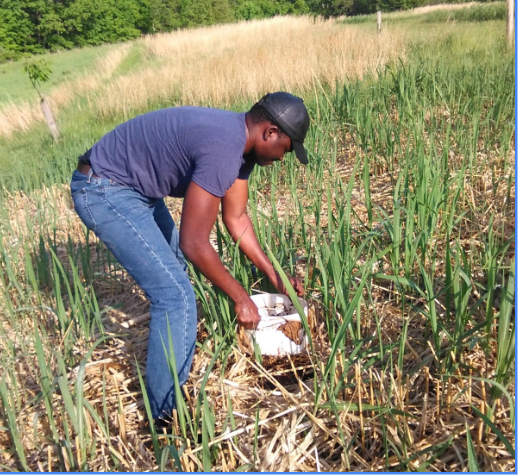
A photo of me in front of a fully grown Miscanthus plot (left). Installing soil collars used to sample soil greenhouse gas fluxes in the summer and fall of 2018 (right).
Development and application of bio-based hydrogels for improving soil hydraulic properties.
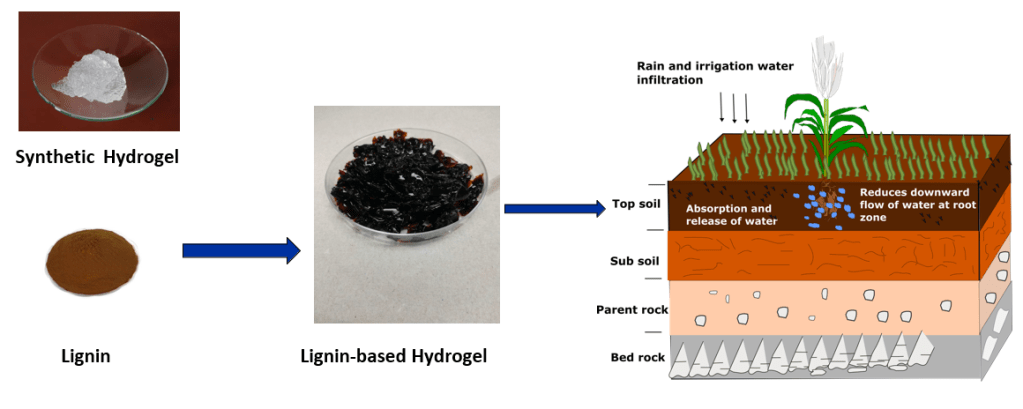
- Due to the high swelling capacity of hydrogels, this project aimed to quantify the impact of the lignin-based hydrogel on soil water retention and soil hydraulic conductivity.
- When hydrogels are applied to soil, they can absorb water when the soil is saturated and release the water back to plant roots for use when soil water potential decreases.
- In this study, we synthesized a biodegradable lignin-based hydrogel and evaluated its potential to enhance soil water retention across the full moisture range—from saturation to dryness—in silt loam and loamy fine sand soils. We characterized the hydrogel using SEM, FTIR, gas pycnometry, and measured its swelling behavior, which reached up to 2013% in deionized water.
- Our findings suggest that lignin-based hydrogels can be a sustainable soil amendment for improving soil water availability, particularly in coarse-textured soils, while also offering an environmentally friendly alternative to synthetic superabsorbents.
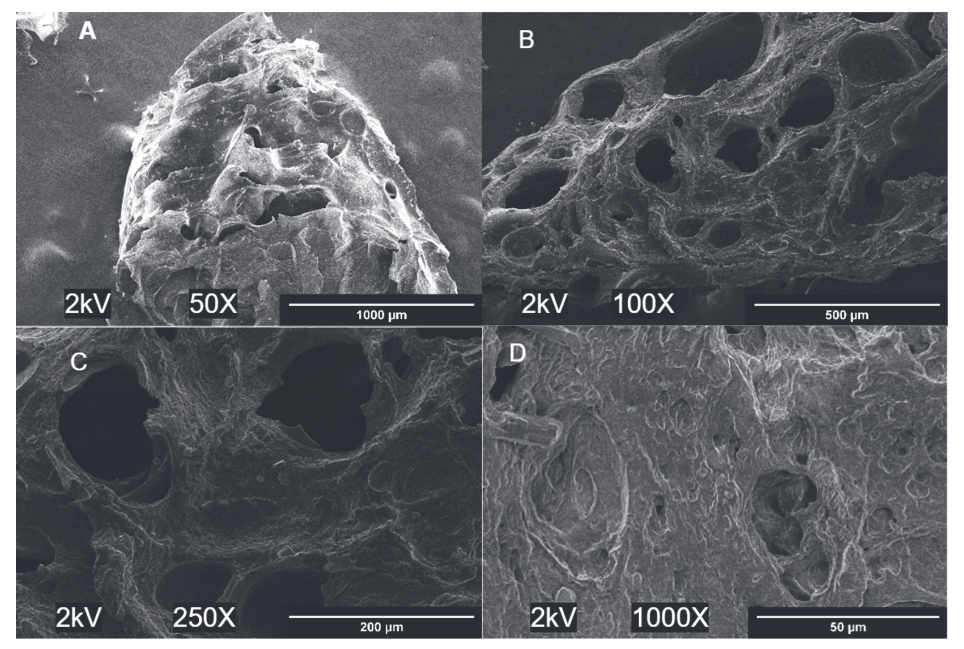
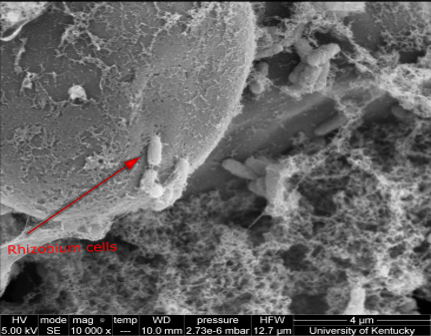
Development of Lignin-alginate-starch Beads for Entrapment and Release of Rhizobium spp
In this study, I developed and tested lignin–alginate hydrogel beads, with and without starch, as a bio-based system for immobilizing and delivering Rhizobium spp., an important nitrogen-fixing bacteria in agriculture. We synthesized and characterized the beads, evaluated their compatibility with Rhizobium meliloti and R. leguminosarum, and assessed entrapment efficiency, cell viability after drying, and release behavior. Results showed that lignin did not inhibit bacterial growth, and incorporating starch significantly improved cell survival after drying—from 61% in alginate-only beads to 84% in lignin–alginate–starch beads. Microscopy confirmed improved bead structure and bacterial attachment to starch granules. These findings demonstrate the potential of lignin-based biopolymer systems for microbial delivery in sustainable agriculture, offering a value-added use for lignin and a biodegradable alternative to conventional carriers.
b) Dried Rhizobium entrapped lignin-alginate- starch beads.
c) Rhizobium entrapped alginate beads
d) Dried entrapped alginate beads
Modelling
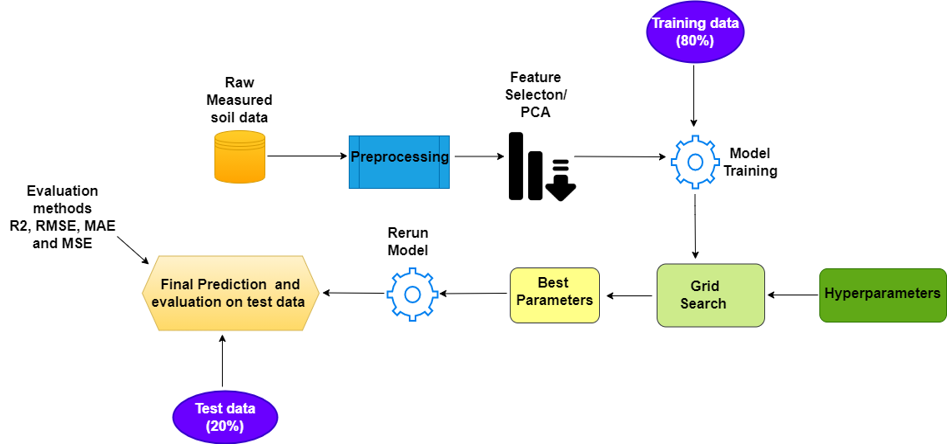
Pedotransfer Functions for Predicting Saturated Hydraulic Conductivity (Ks) using Machine Learning Algorithms.
I developed machine learning models to predict saturated hydraulic conductivity (Ks) using over 8,000 soil samples from the Florida Soil Characterization Database. Among six tested methods, tree-based models—random forest and gradient boosting—achieved the best performance (R² = 0.71). The analysis highlighted clay content and bulk density as the most important predictors. This work shows that combining large soil datasets with machine learning can produce accurate, interpretable tools for estimating soil hydraulic properties critical to agriculture and hydrology.
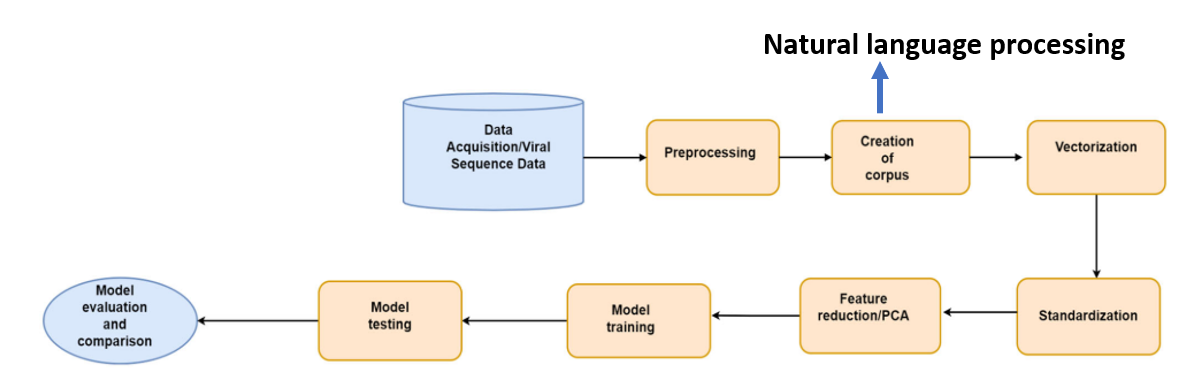
Machine Learning Models to Generate Protein Vectors for Predicting COVID-19
In this study, I collaborated with a colleague to develop machine learning models to rapidly classify COVID-19 viral sequences using protein vectors generated through natural language processing (word embedding techniques). Five models—K-nearest neighbors, support vector machine, random forest, linear discriminant analysis, and logistic regression—were trained using viral sequence data from the National Center for Biotechnology. The random forest model achieved the highest performance, with 99% accuracy on the training set and 99.5% on the test set. These results demonstrate the potential of AI-driven tools to support fast, reliable detection of COVID-19 in clinical settings
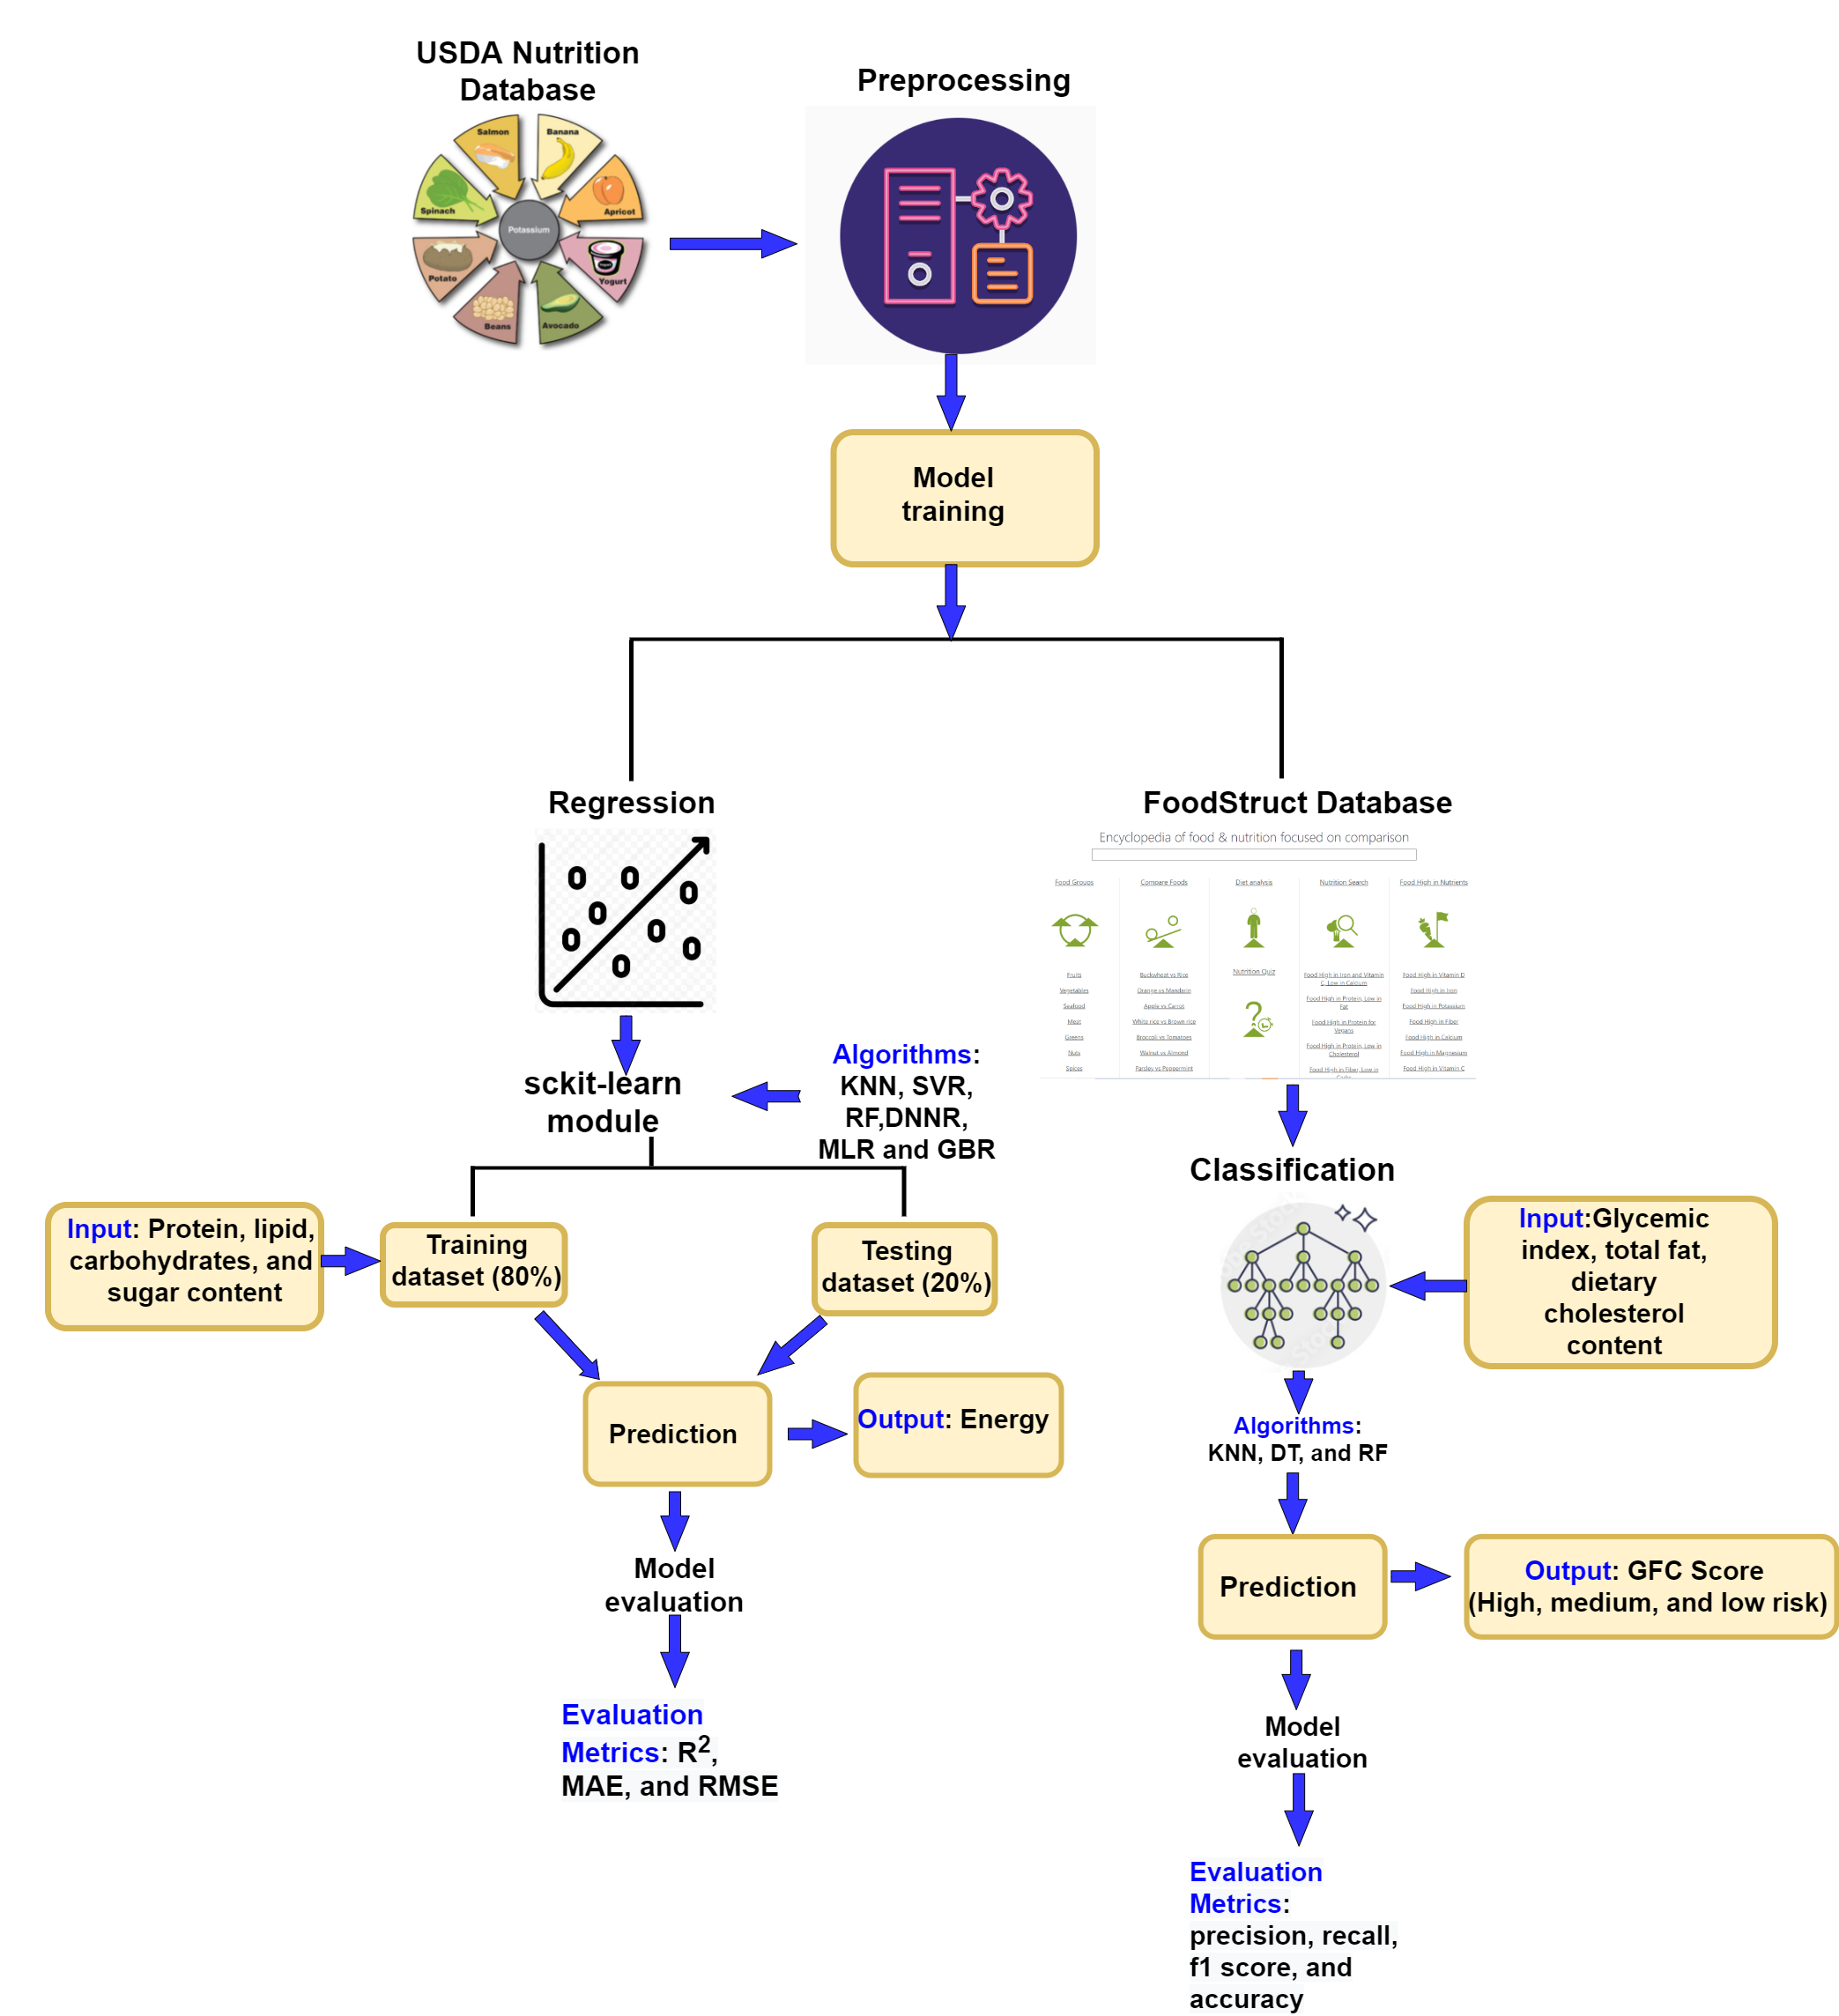
Enhancing dietary analysis: Using machine learning for food caloric and health risk assessment
In this study, I applied machine learning to estimate how many calories are in food and to understand the health risks different foods might have. By investigating the fats, cholesterol, and sugars in food items listed in a public database, we can better plan diets or develop apps that help people make healthier eating choices. This work aims to improve public access to nutritional information, supporting efforts to combat diet-related diseases through educational materials and applications that guide dietary choices in various settings.

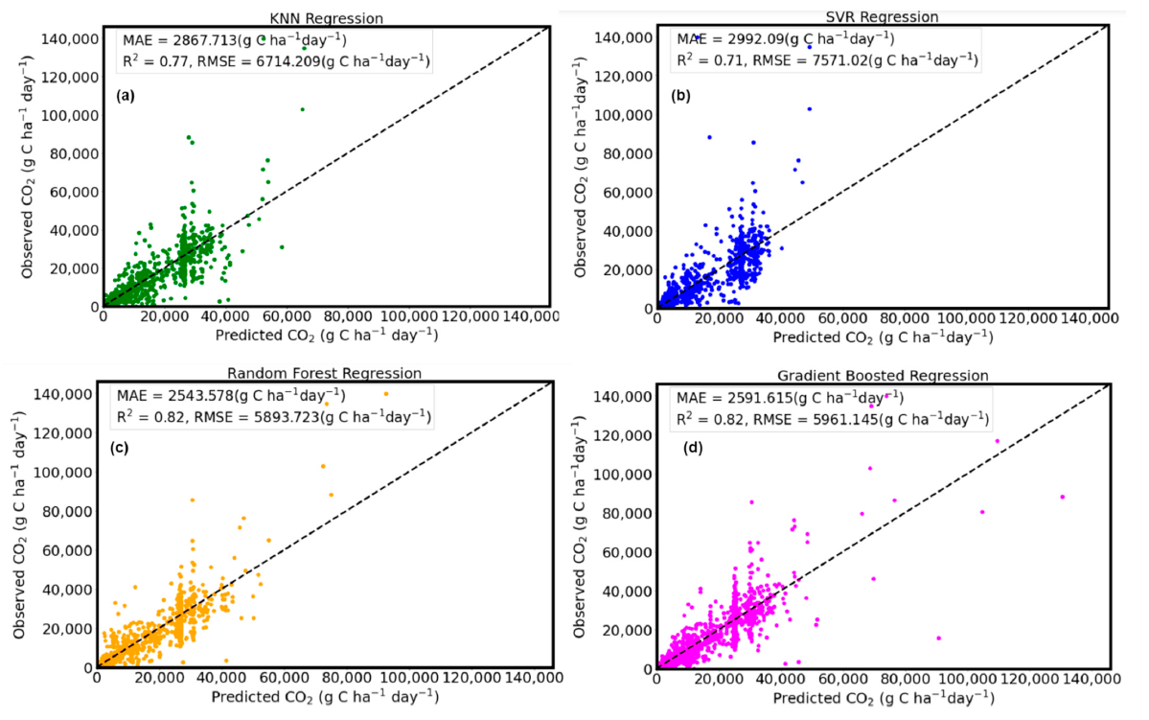
Process-based Model Development to Estimate Soil Greenhouse Gas Emissions in Bioenergy Cropping Systems
The objective is to develop and validate a process-based model to simulate nitrification and denitrification N2O fluxes of the bioenergy crops.
